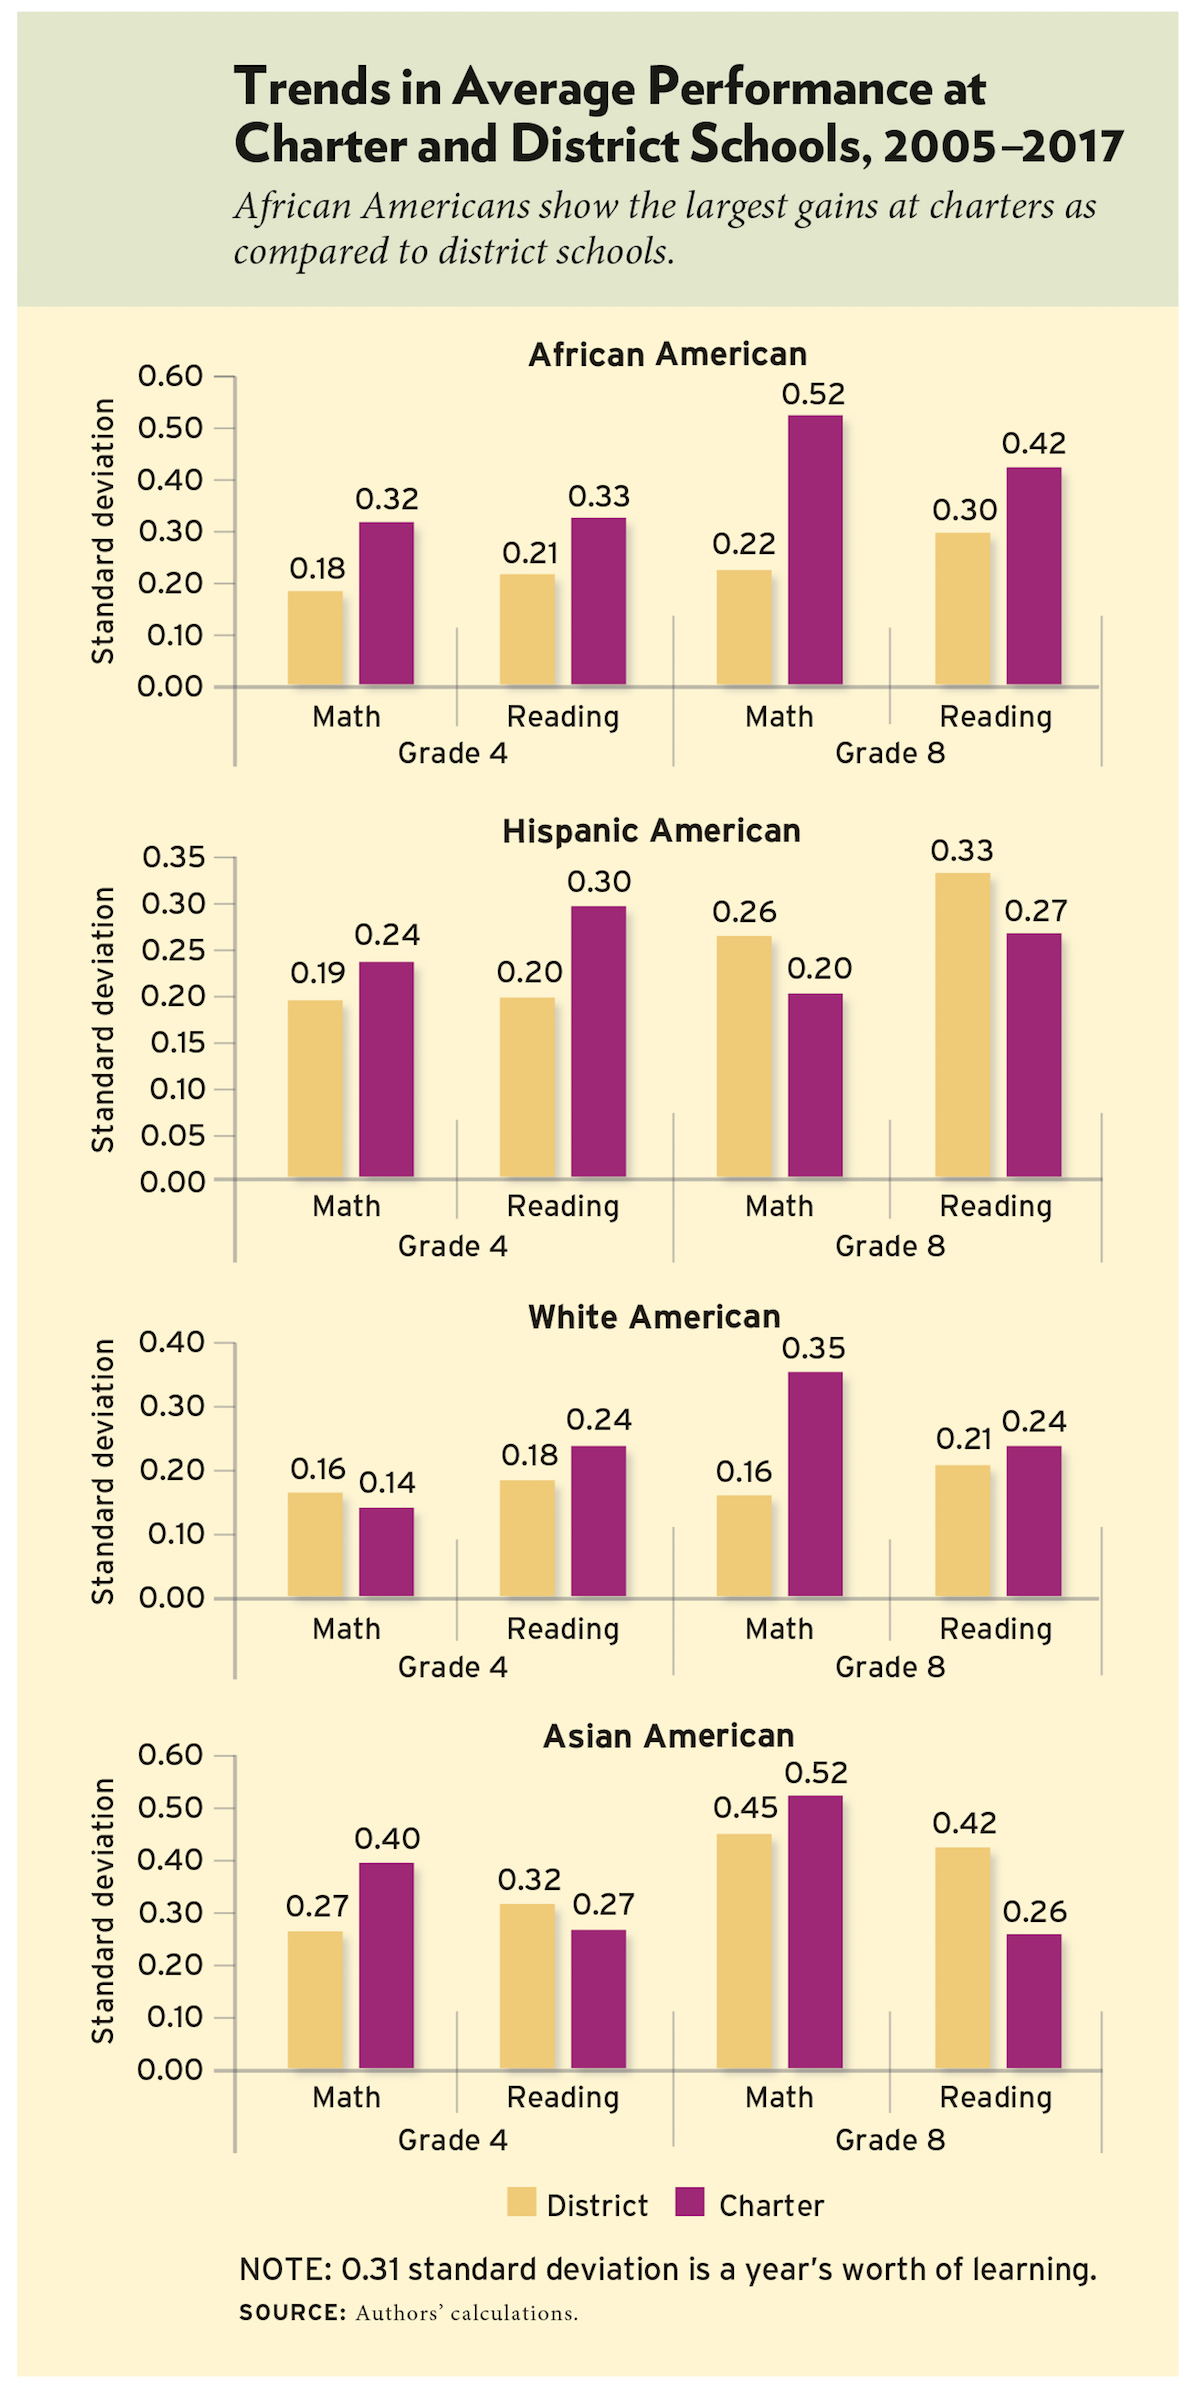
 In September we released an article on the Education Next website titled “Charter Schools Show Steeper Upward Trend in Student Achievement than District Schools.” Using a sample of more than four million test performances, it compares the progress made by cohorts of charter and district school students on the National Assessment of Educational Progress (NAEP) from 2005 to 2017. Overall, students at charters are advancing at a faster pace than those at district schools. The strides made by African-American charter students have been particularly impressive. We also see larger gains at charters, relative to district schools, by students from disadvantaged backgrounds. We saw more moderate differences between the two sectors for white students, and, among Asian Americans and Hispanic Americans, both sectors made sizeable, comparable strides forward. The figure below breaks out the results by both sector and ethnicity.
Our results have stimulated a good deal of conversation among policy analysts, particularly among those who support school charters. We have been surprised at the modest amount of criticism the study has received from charter critics. However, a report on the study in The 74 includes a critical comment by one observer, who suggests the sample we used was “skewed” in favor of urban charters, a locale where charter students are improving at a more rapid pace than those in district schools.
We were puzzled by the criticism because the sample used for our study comes directly from NAEP, often referred to as the nation’s report card, which, in compliance with federal law, seeks to draw a representative sample for each state and for the United States as a whole. Admittedly, NAEP draws its sample to be representative of all public school students, not to be representative of the district and charter sectors separately. It is conceivable, though not likely, that NAEP somehow drew its charter sample in such a way as to over-represent urban students.
For such a skew to bias our results, the skew would need to increase between 2005 and 2017, because our study shows only that cohorts of students at charter schools, on average, are improving at a more rapid rate over this period than those at district schools, not that the average charter school student is performing at a higher level than the average district school student.
Fortunately, we can check to see whether the composition of students tested by NAEP has become increasingly urban in a way that is inconsistent with trends reported by the National Center for Education Statistics (NCES) between 2007 and 2017. (The year 2007 is the first year for which the definition of urban is the same for the two data sets.) The comparison between the two data sets must be done cautiously because they are not measuring the same population and they are both subject to error. NAEP samples only students in 4th and 8th grade, because those are the two grades it tests (we excluded grade 12 due to the low number of observations for charters). NCES asks all public schools in the United States to report enrollment for all students in elementary and secondary schools. Further, NAEP tests in the spring, whereas NCES reports fall enrollments. And reporting error can bedevil any national data collection effort.
Even with these caveats, an inspection of the urban composition reported by both NAEP and NCES is instructive. If the skewness hypothesis is correct, it implies that the urban trend is steeper in the NAEP than the NCES data set. But in fact, the trend is just the opposite of what the skew hypothesis implies (see the table below). In 2007, and even more in 2011, urban charters were over-represented in the NAEP data set (as compared to the NCES one), but that shifts to under-representation of urban charters in NAEP by 2017. In this final year of the available data, the urban share in the NAEP sample is 3.5 percentage points less than percentage given in the NCES data set. If the NCES data correctly identify the percentage of 4th and 8th grade students in urban charters, students in urban charters are under-represented in NAEP in 2017, after having been over-represented previously.
Share of charter school students in urban areas, as reported by NAEP and NCES
| Year | NCES | NAEP | NCES Source |
| 2007 | 54.3 | 55.4 | https://nces.ed.gov/programs/digest/d14/tables/dt14_216.30.asp |
| 2009 | 54.8 | 53.06 | https://nces.ed.gov/programs/digest/d14/tables/dt14_216.30.asp |
| 2011 | 55.5 | 60.87 | https://nces.ed.gov/programs/digest/d19/tables/dt19_216.30.asp |
| 2013 | 56 | 58.26 | https://nces.ed.gov/programs/coe/pdf/Indicator_CLA/coe_cla_2016_05.pdf |
| 2015 | 56.5 | 55.29 | https://nces.ed.gov/programs/digest/d17/tables/dt17_216.30.asp |
| 2017 | 56.1 | 52.52 | https://nces.ed.gov/programs/digest/d19/tables/dt19_216.30.asp |
Note: Summary statistics are presented using survey weights.
SOURCE: U.S. Department of Education, National Center for Education Statistics, 2005–2017 Main NAEP.
In the original paper, we break out trends by locale, so that people can see for themselves whether urban charters are doing better than suburban charters. They are. But that fact does not support the suggestion that the entire sample over-estimates the gains in the charter sector. Given the apparent under-representation of urban charter students in 2017, it is more likely that we are under-estimating the overall gains in the charter sector.
M. Danish Shakeel is a postdoctoral research fellow at the Program on Education Policy and Governance at Harvard University. Paul E. Peterson is the Henry Lee Shattuck Professor of Government and director of the Program on Education Policy and Governance at Harvard University, a senior fellow at the Hoover Institution at Stanford University, and senior editor of Education Next.
The post Charters Improving at Faster Pace in Urban Areas appeared first on Education Next.