 Racial segregation in U.S. schools has been illegal since the 1950s, but school enrollments remain stubbornly separate. About 70 percent of all Black students attend schools where more than half of students are non-white. By contrast, just 13 percent of white students attend predominately non-white schools. Such disparate enrollments mirror longstanding differences across racial groups in educational and economic outcomes, including Black-white gaps in educational achievement, wages, and economic mobility.
In this study, we focus on one potential driver of racial gaps in adulthood: special education identification. Research has consistently found that minority students are identified with disabilities at higher rates than white students, based on straightforward comparisons of classification rates across racial groups. Such comparisons are how federal special education law defines and regulates “disproportionality” in the share of students identified with a disability within schools and districts, which triggers increased monitoring and intervention by states.
But recent research has shown that the story becomes more complex when minority students are compared not to all white students, but to white students of similar socioeconomic status. These studies find that minority students are less likely than otherwise similar white students to be identified for special education. This finding raises the possibility that Black and Hispanic students may be less likely to receive the specialized services they need. Is “disproportionality,” as it is typically understood and measured, the real problem? What role does school segregation play in special education rates?
We explore these questions by examining the birth records and eventual special education status of every child born in Florida between 1992 and 2002. The birth records capture both infant and maternal health, as well as demographics and economic circumstances, allowing us to compare students born into similar circumstances whose observable characteristics differ only by race and the racial compositions of their local schools.
Our results show that, by 4th grade, the disability rate among Black students is 13 percent lower than it would have been if they were identified at the same rate as white students born into similar economic and health circumstances. For Hispanics, the overall identification rate is 8 percent lower than what we would predict for similarly situated white students.
These gaps play out differently based on the racial composition of schools. Black and Hispanic students are placed in special education more often than their peers when they are in majority-white schools. But in predominately minority schools, when surrounded by other non-white students, Black and Hispanic students are less likely to be placed in special education. In 4th grade, a Black student attending school where more than 90 percent of students are minorities is roughly 9 percentage points less likely to be identified as disabled than an observationally identical Black student in a school with fewer than 10 percent minorities.
Our estimates suggest that minority students in heavily-minority school groups are underrepresented in special education relative to their underlying incidence of disability. While public debate has fixated on the harmful effects of too many Black and Hispanic students being identified as having special needs, our results echo the recent research suggesting that, in fact, too few minority students are being provided the educational services they need to thrive. Given ongoing public focus on equity and disproportionality, and the longstanding goal of closing gaps in educational achievement between white and non-white students, such widespread underrepresentation has substantial implications.
Mapping Special Education Rates to Newborn Characteristics
Roughly 6.4 million public-school students in the United States receive special education services annually, at an estimated cost of nearly $40 billion. Special education provides a vehicle for accommodations and, in many cases, treatment for students with learning disabilities. These services are established by each student’s “individualized education plan,” which outlines the services and accommodations to which the student is legally entitled under the federal Individuals with Disabilities in Education Act.
The law requires the provision of a “free appropriate public education” to students with special needs. This phrase, and the wider law, is the lynchpin for special education services in the U.S. Nonetheless, states vary considerably in how they direct special education funding, the services provided, and how students are evaluated. In Florida, as in most states, identification for special education is jointly determined by parents and educators. The decentralized and subjective nature of this process means that there is likely a substantial amount of variability in identification relative to the underlying incidence of disability. Parents who are more active in their children’s schooling could be more likely to advocate for special education services, for example, and teachers may differ in their propensity to identify disabilities.
Since 1997, the law has required states to address disproportionality in classification rates, which is defined based on ratios of identification rates for different racial groups in a school or district. For example, if 15 percent of Black students in a district are identified as disabled compared to 10 percent of white students, the law would measure disproportionality for Black students as 1.5. The law requires states to take action if districts show “significant disproportionality,” which traditionally states themselves have defined. A 2016 update to the regulations implementing the law, which was delayed by the Trump administration but ultimately took effect last year, is intended to create a more uniform process for states to monitor, identify, and remedy disproportionality.
We focus our study on Florida based on a unique merger of student enrollment and classification information from the state department of education and birth records from the state bureau of vital statistics. The linked records include all children born from 1992 to 2002 who were enrolled in any Florida public school at any time from 1995–96 through 2012–13. We restrict our analysis to students observed in both kindergarten and 4th grade, leaving us with 869,000 students.
The birth-certificate data include a wealth of information about both child and maternal health status at birth and during the pregnancy. This includes a newborn’s gender, race, birth weight, gestational age, Apgar scores assessing responsiveness at one and five minutes after birth, congenital anomalies, and abnormal conditions, as well as complications during delivery and the mother’s prior births and pregnancy-related health diagnoses. The data also include demographic and economic characteristics, including the mother’s marital status, educational attainment, race, and immigration status, as well as the language spoken at home and the zip code of residence when the child was born. For child’s race, we exclude the small numbers of Asian/Pacific Islanders and Native Americans and examine only the gaps between white, Black, and Hispanic children. It is important to note that we must restrict our analyses to native-born children; this limitation is particularly consequential when estimating identification gaps for Hispanics, as we necessarily exclude a large portion of the Hispanic population who are immigrants.
The enrollment and classification data show whether students were identified as needing special education services. In addition to examining overall identification rates, we disaggregate students’ diagnoses into six broad categories: intellectual disabilities; developmental delays and autism spectrum disorder; speech and language impairments; specific learning disabilities; physical disabilities; and other disabilities, which includes attention deficit hyperactivity disorder. We consider identification in both kindergarten and 4th grade, because they span most of elementary school and potentially capture different disability conditions.
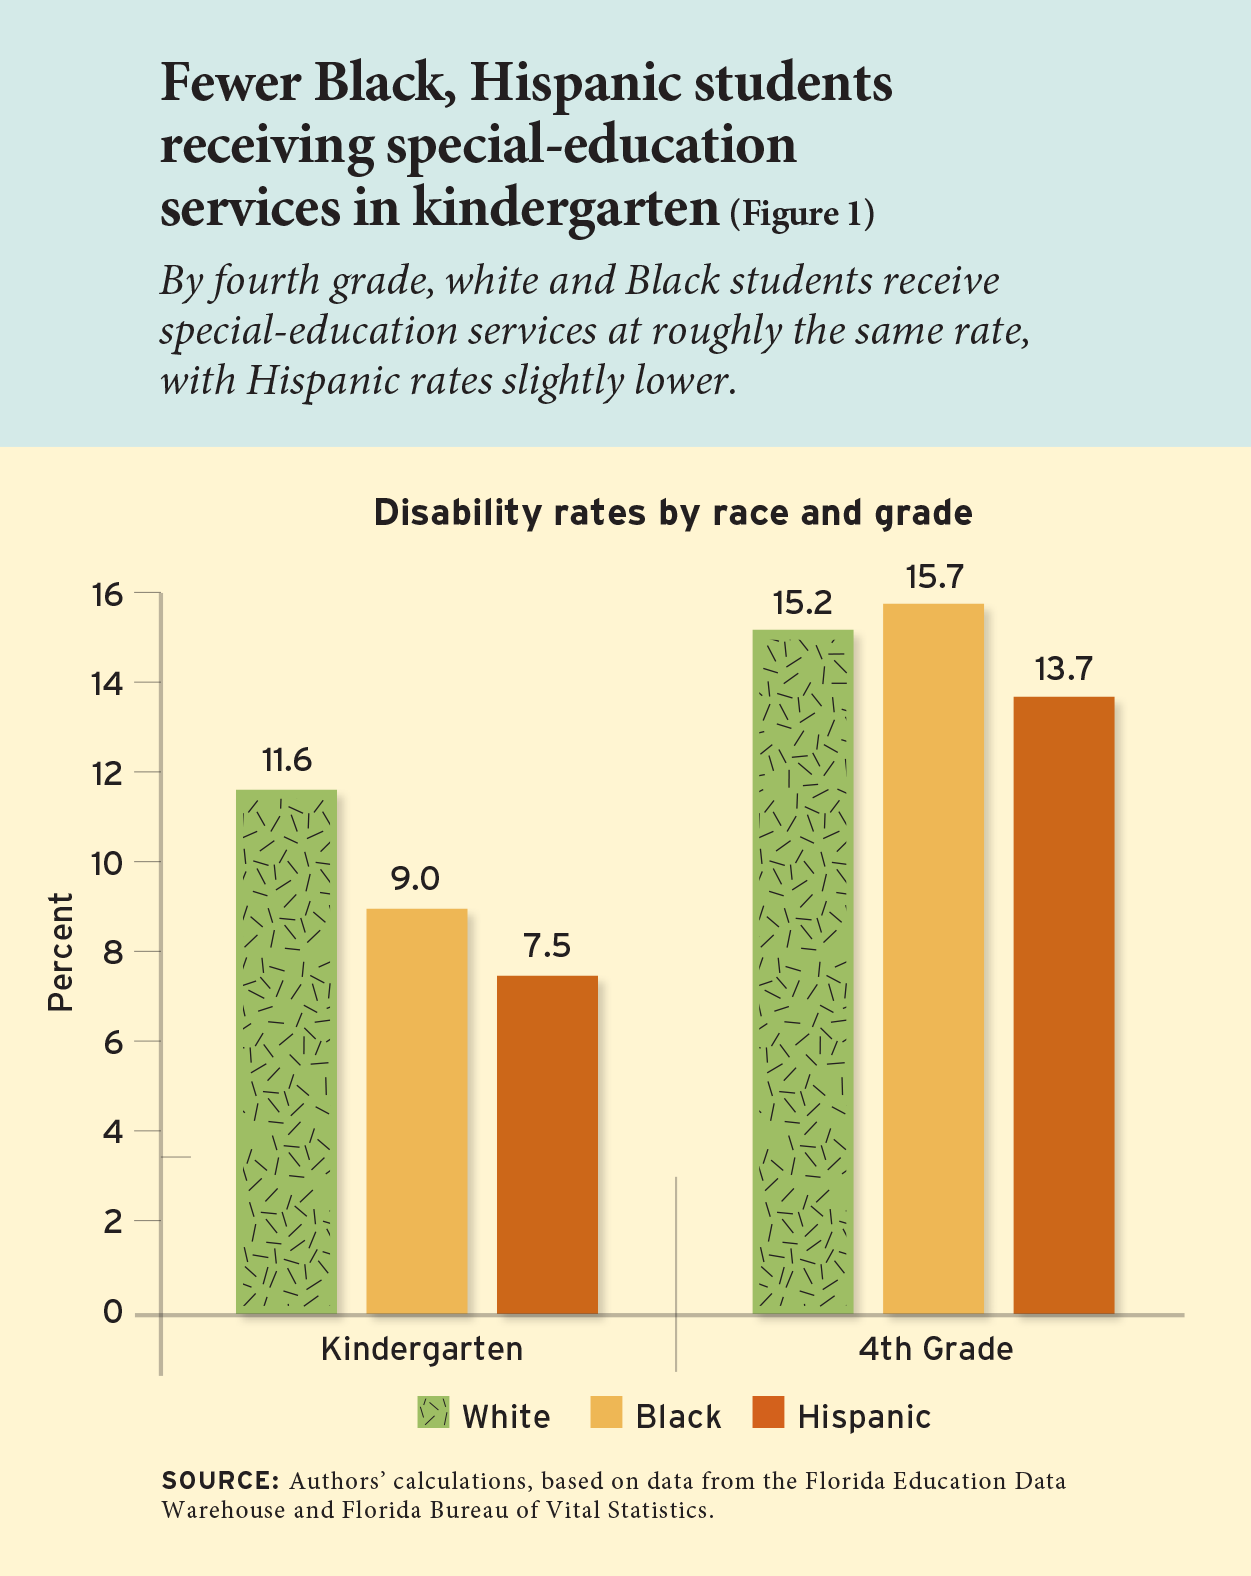
In kindergarten, Black and Hispanic students have lower disability rates than white students (see Figure 1). But by 4th grade, white and Black students are roughly at parity, with Hispanic disability rates remaining slightly lower. When looking at different types of disabilities, we see that minorities are less likely than white students to be identified for speech and language impairment, but more likely to be identified with a specific learning disability, such as dyslexia. Other conditions do not substantially vary across races in kindergarten, but by 4th grade Black students have substantially higher intellectual and “other” disability rates than both whites and Hispanics.
Our data also reveal important differences between students by race at birth. For example, relative to white and Hispanic students, the average birthweight of Black students is 6-7 percent lower. In a separate analysis of this data, we found that children with lower birthweights are more likely to be diagnosed with disabilities throughout elementary school. A birthweight deficit of this size implies an increase of 0.8 percentage points in disability rates, providing an initial indication that disparities in health endowments across race and ethnicity may play an important role in special education gaps.
Explaining Special Education Gaps
In this analysis, our primary interest lies in assessing the extent to which racial differences in classification for special education can be “explained” by differences in students’ economic, social, and health characteristics at birth. We start by analyzing the relationship between these characteristics and classification rates for white students only. We then use those results to calculate predicted special education placement rates for Black and Hispanic students in light of their demographic and health characteristics. Finally, we compare the predicted and actual identification rates for Black and Hispanic students. These “unexplained” classification gaps tell us how much higher or lower we would expect the classification rate for minority students to be if they were identified at a rate similar to white students with the same characteristics.
Our analysis reveals that Black students are underrepresented in special education relative to observably similar white students. Hispanic students are similarly underrepresented in kindergarten, but this identification gap narrows by 4th grade.
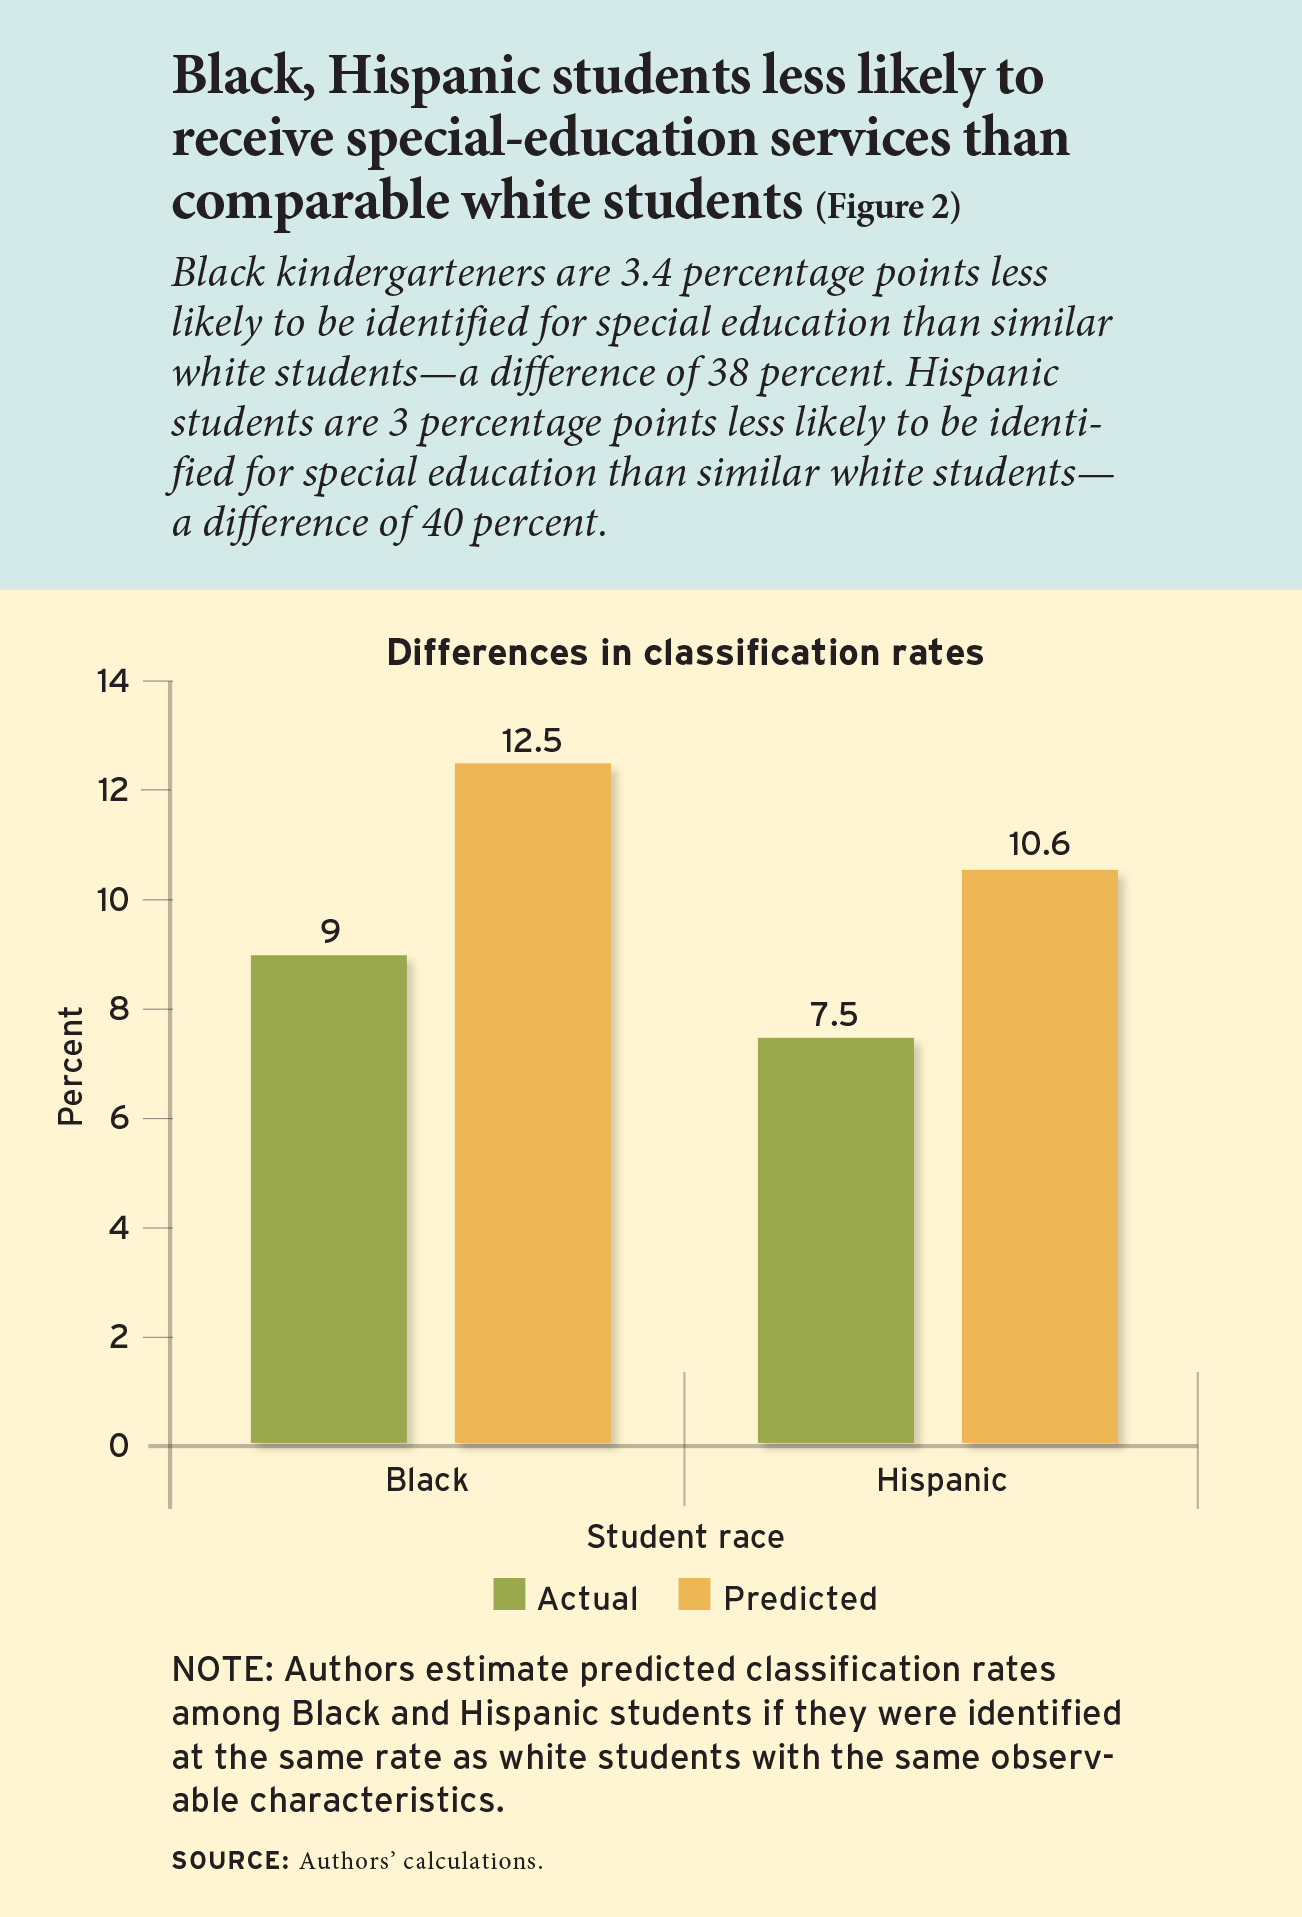
For Black students, 9 percent of kindergarteners are classified, compared to 11.6 percent of white students. If Black students were classified at the same rate as white students with the same observable characteristics, 12.5 percent would be identified as needing special education—an unexplained gap of 38 percent (see Figure 2). In 4th grade, the overall classification rates of Black and white students are similar, at 15.7 percent and 15.2 percent, respectively. But if Black students were classified at the same rate as comparable white students, 18.1 percent would be classified. That implies that Black 4th graders are underrepresented by 15 percent, given their observable characteristics.
At the same time, we do find evidence that Black students are substantially overrepresented among students classified as having intellectual disabilities, defined as being significantly below average in general mental functioning. In 4th grade, 13.4 percent of Black students are identified as having an intellectual disability, compared to a predicted rate of 7.4 percent for white students with the same observable characteristics. It is possible that unobserved differences between Black and white children may explain the overrepresentation in this category, but such differences would have to be both large and fundamentally different from Hispanic-white differences.
For Hispanic students, 7.5 percent of kindergartners are identified for special education compared to 11.6 percent of white students. If Hispanics were classified at the same rate as white students with the same observable characteristics, 10.6 percent would be identified as needing special education—a gap of 40 percent. That gap shrinks to 8 percent in 4th grade, when 13.7 percent of Hispanics are classified, compared to a predicted identification rate of 14.8 percent. In looking at various types of disabilities, we find Hispanics are underrepresented among students with speech and language impairments and overrepresented as having a learning disability. Unlike Black students, there is essentially no Hispanic-white gap in intellectual disability rates, despite Hispanics being relatively disadvantaged along many of the same dimensions as Black children. Overall, there is little indication of consistent underrepresentation or overrepresentation of Hispanic students relative to white students conditional on health and economic endowments.
Results by School Racial Composition
We next assess whether observationally identical students of different races are more or less likely to be classified and receive special education services based on which school they attend. This is a difficult question to answer, because parents of children with special needs may actively choose particular schools based on their performance or resources for special education. We therefore conduct our analysis two different ways. In our main analysis, we use data on the racial composition of the school the child actually attends in kindergarten. As an alternative, we calculate school racial composition based on local enrollment data for the zip code of the student’s residence at birth. Most parents are not aware of a child’s disabilities before they are born, so this “school” measure is less likely to be influenced by any strategic choices parents make in response to a child’s disability. Our results are unaffected by this choice. That is, it does not matter for the findings whether or not we account for any potential strategic choices that determine school racial composition.
We then examine how disproportionalities in special education identification vary across schools with different racial compositions, focusing on 4th grade. Overall, Black and Hispanic students are more likely to be classified for special education programs in schools where there are few minorities and less likely to be classified in schools with large numbers of minority students. The unexplained gaps between rates for minority students and those for similar white students are largest at the most segregated schools. By contrast, classification rates for white students are far less sensitive to school racial composition.
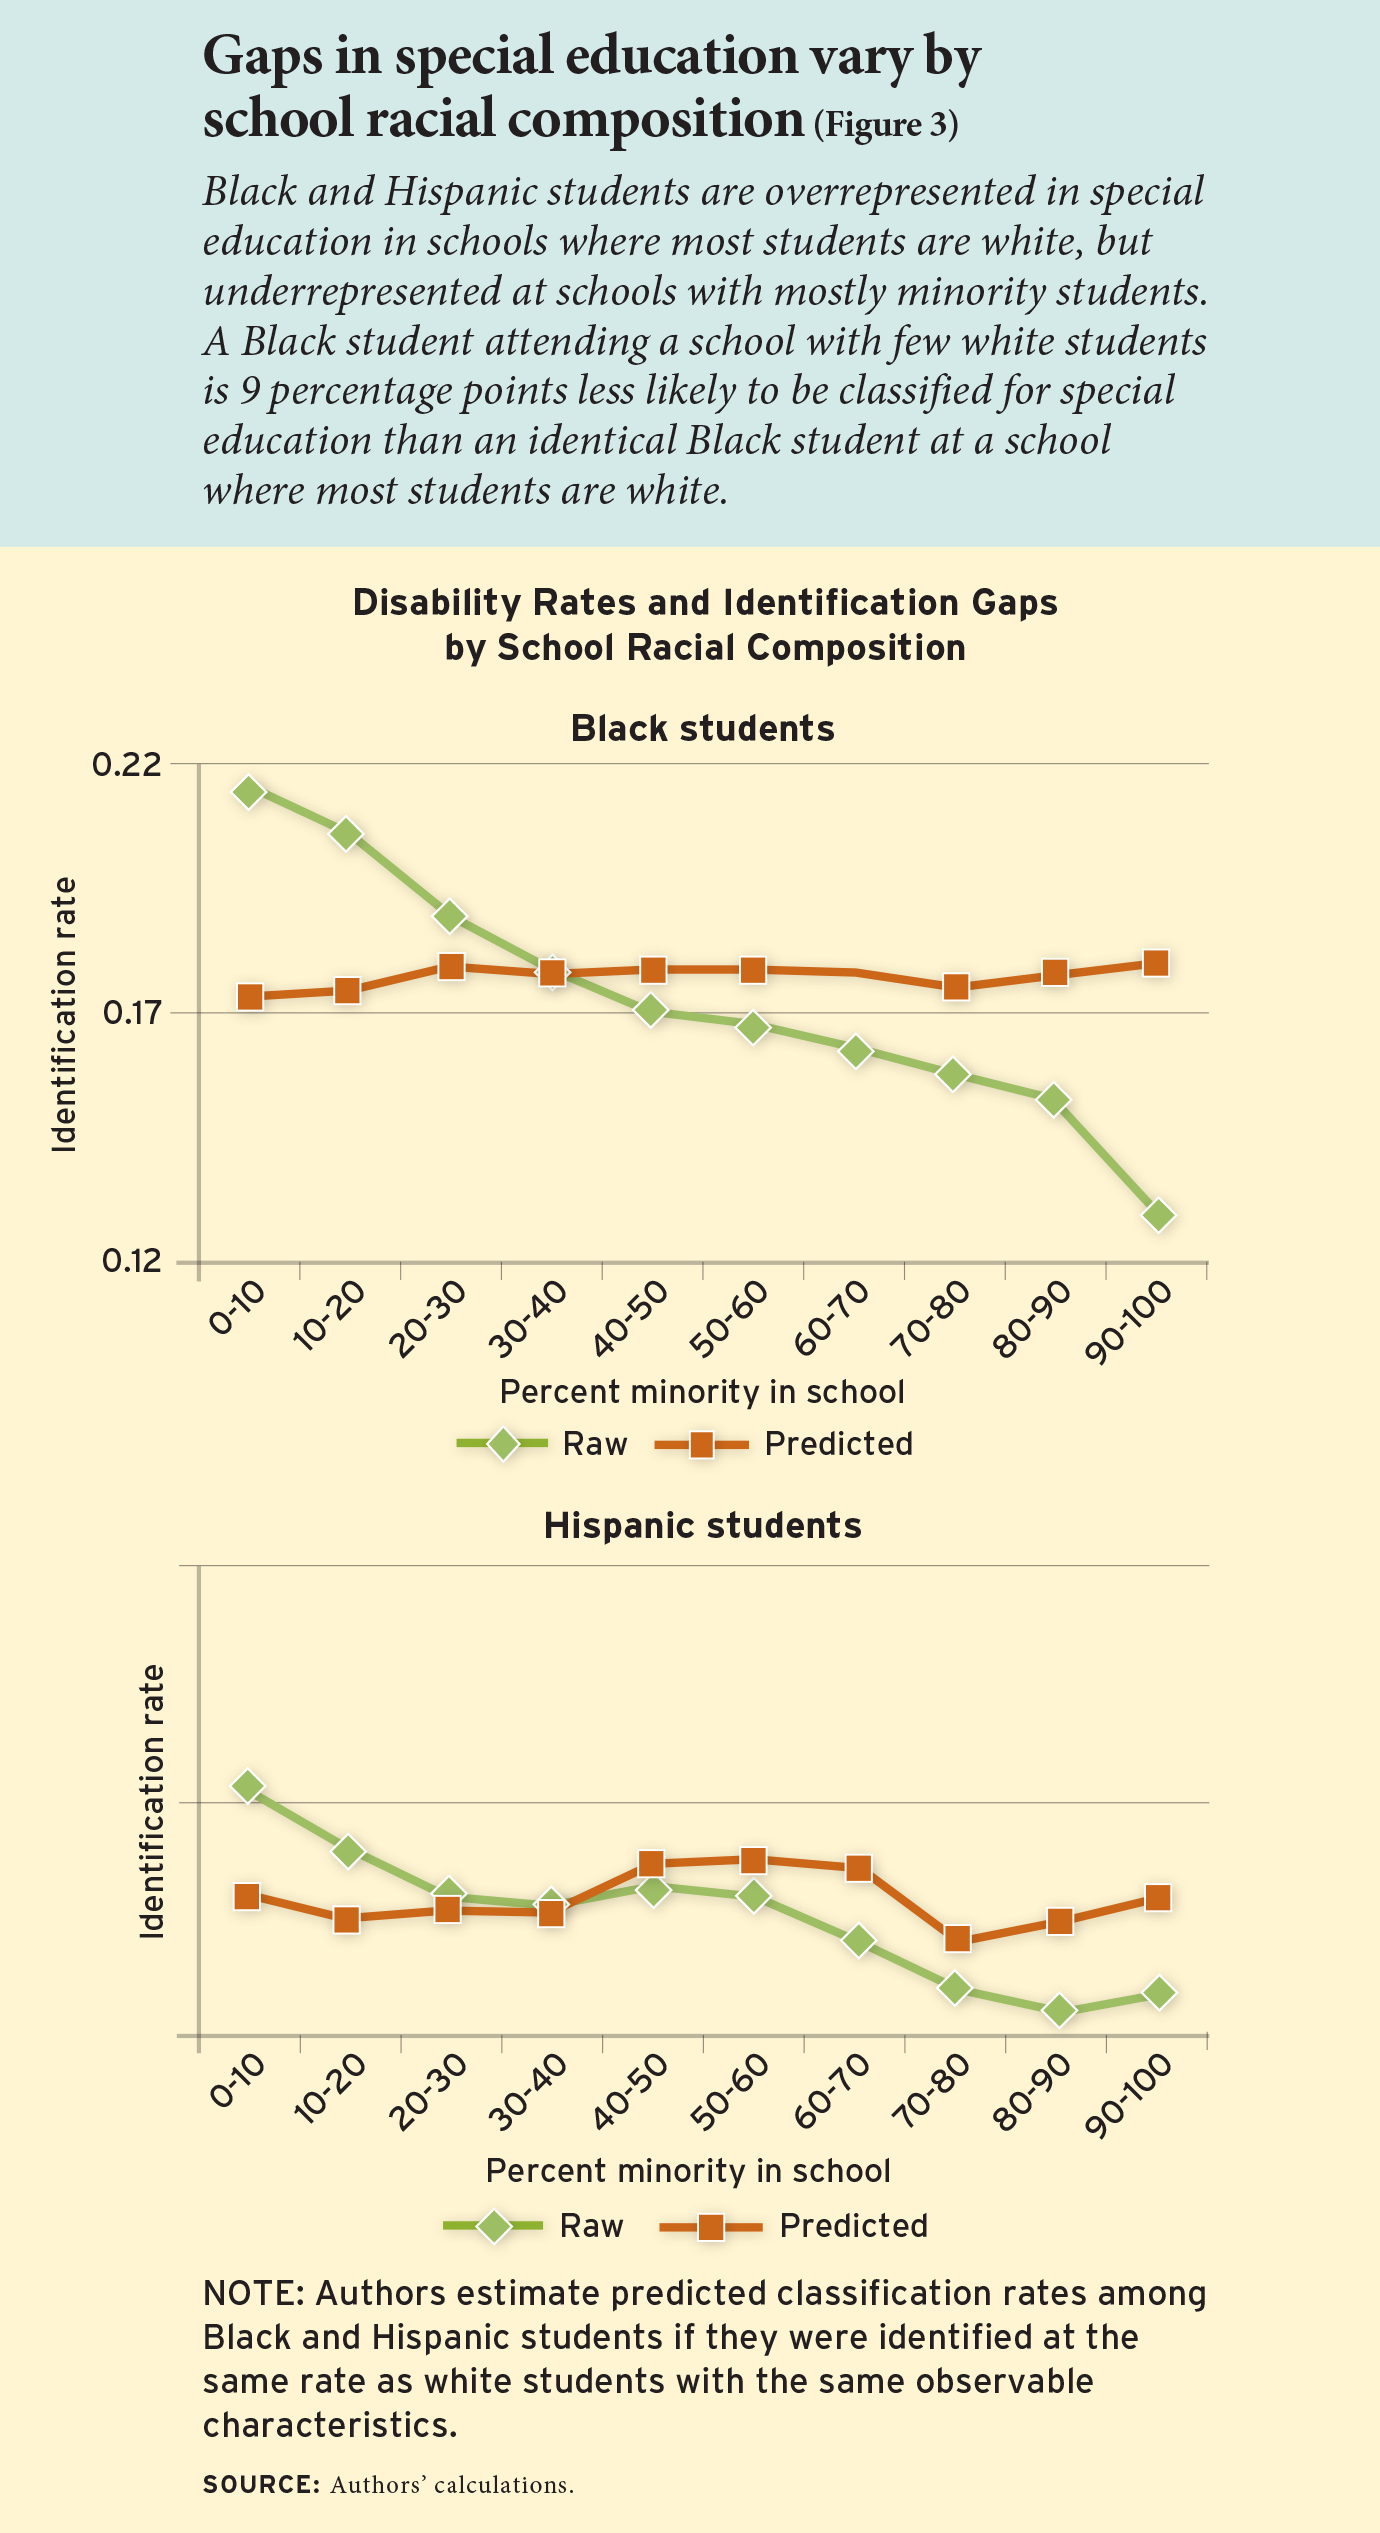
This trend is starkest for Black students, with the largest unexplained gaps in classification rates at schools with the most segregated populations. In schools with fewer than 10 percent minority students, a Black student is 3.8 percentage points more likely to be identified as disabled than an observationally equivalent white student (see Figure 3). This value steadily decreases as the minority share of a school grows, so that a Black student in a school with more than 90 percent minority students is 5.3 percentage points less likely to be identified than an observationally equivalent white student. We find that for every 10-point increase in the minority share, underrepresentation among Black students increases by approximately 0.9 percentage points.
For Hispanics, we find similar, but smaller, gaps showing that Hispanic students are more likely to be identified for special education in predominately white schools and less likely in schools attended mostly by students of color. Students in schools with fewer than 10 percent minority peers are overrepresented by 2.0 percentage points—roughly half the analogous figure for Black students—while those in schools that are 90 percent or more minority are underrepresented by 2.0 percentage points.
Implications
Our results do not necessarily imply a causal relationship between racial segregation and disability identification. The racial composition of a school could be a proxy for a number of other factors, such as family economic conditions, resource constraints, or school switching. To isolate the influence of racial composition on classification gaps we investigate these other potential factors and, for Black students, rule them out.
We first consider the role of local economic conditions, by looking at the share of students eligible for free or reduced-price school lunch. When controlling for this factor, unexplained gaps in special education classification largely disappear for Hispanics but not for Black students.
Second, we consider the potential influence of resource constraints, by looking at the identification of gifted students. Giftedness classification is similarly subjective, and services for students deemed eligible also represent an additional expense. But we find that Black, Hispanic, and white students are all more likely to be identified as gifted, relative to predictions based on their economic and health conditions at birth, if they attend a school with a large share of minority students. This pattern suggests that resource constraints are not the principal driver of disability gaps.
Finally, and as explained above, we compare our main estimates, which are based on the racial composition of the schools students actually attend, to estimates based on the racial composition of schools near where students were born. The fact that these two sets of estimates are largely the same suggests that parents’ moving in response to disability diagnoses does not contribute to our results.
Our analysis points to the importance of group dynamics in special education classification decisions. For example, if a school’s student population is relatively healthy, then the threshold impairment level for what defines a “disability” may fall, inducing diagnoses among children who would not be identified as disabled in schools with less healthy peers. In our data, we do see evidence that Black students have worse newborn health characteristics than both Hispanic and white students. In addition, we see that students who attend schools with predominately Black and Hispanic students have much worse newborn health characteristics than students who attend less racially segregated schools. But this explanation cannot on its own account for the fact that, unlike Black and Hispanic students, white students are slightly more likely to be placed in special education in schools with more minority students.
An alternative—and potentially complementary—explanation is that the relative distinctness of students’ race might play a role in identification. For example, Black and Hispanic students may “stand out” in schools with mostly white students, making their perceived disabilities more readily noticed in comparison to identical students in schools with large minority populations. Such a phenomenon would lead to Black and Hispanic students being overrepresented at schools where they are in the minority and underrepresented at schools where they are in the majority. This is consistent with our findings.
Ultimately, we acknowledge that we are unable to account for all determinants of disability identification in American schools. Our findings nonetheless have important implications for how disproportionality is defined and monitored under the Individuals with Disabilities Education Act. Fundamentally, the law considers racial disproportionality to be an outcome in and of itself that requires remediation—hence the focus on raw racial differences in most prior studies and the concerns among policymakers and advocacy organizations about over-diagnosis of Black and Hispanic students.
Our analysis adds to recent evidence that underrepresentation of Black and Hispanic students in special education is the more pressing challenge in many settings. It also reveals how racial segregation influences classification decisions. Strengthening disproportionality monitoring and rules is generally understood as a strategy to promote equitable treatment for minority students. But a more nuanced accounting of disproportionality deserves strong consideration. A formula that fails to account for health and other baseline differences among students may unintentionally encourage schools and districts to reduce access to special education services for the minority students who need them.
Todd E. Elder is MSU Foundation Professor at Michigan State University. David N. Figlio is Orrington Lunt Professor and Dean of the Northwestern University School of Education and Social Policy and research associate at the National Bureau of Economic Research. Scott A. Imberman is professor at Michigan State University and research associate at the National Bureau of Economic Research. Claudia L. Persico is assistant professor at American University and research affiliate with the IZA Institute of Labor Economics and Institute for Policy Research at Northwestern University. This article is adapted from a study published in the Journal of Labor Economics.
The post Segregation and Racial Gaps in Special Education appeared first on Education Next.
[NDN/ccn/comedia Links]
News…. browse around here