
Charter schools now represent 7 percent of national school enrollment. In a growing number of cities, this number is well above 40 percent. This represents one of the most dramatic shifts in the structure of U.S. schooling in the past half century. An entire sector of publicly funded, privately run schools has emerged from scratch that now rivals private schools in its size and scope.
We have learned a great deal from the charter-school experience. Most prior research has focused on how well charter schools serve the students who attend them. These “participant effects” are, on average, small and positive for test scores—more positive in urban areas and in schools using a “No Excuses” approach to instruction and discipline. The results have also generally improved over time, perhaps because charter schools and their partners have had more time to learn from experience.
But charter schools could have broader effects on schooling systems as a whole. Other studies have examined the effects of charter schools on nearby traditional public schools. Sometimes called “competitive effects,” these influences actually reflect a range of ways in which nearby traditional public schools might respond to charter schools. The competitive effects documented in past research, too, are typically small and positive.
Another potential effect of competition is that traditional public schools might be forced to close. Charter schools draw enrollment from traditional public schools. The loss of students can make the traditional public schools less viable, financially and academically. Closures are painful, to be sure. However, a growing body of research suggests that if the schools that close are among the lowest performing, then students benefit academically because they end up in better schools. We know little, however, about the effect of charter schools on the closure of other schools.
More generally, we are not aware of any studies that capture the net or systemwide effects of charter schools including all of these mechanisms. Prior research therefore gives us only a partial picture. We decided to address this issue. Instead of focusing on one particular mechanism—participant or competitive effects—we try to estimate the net effect of almost all the potential mechanisms. Instead of focusing on particular cities or states, we take a national look. And, instead of focusing on test scores alone, we consider both scores and high-school graduation rates. In short, we aim to provide a bigger picture of charter school effects.
National Data and Analysis
We included essentially all school districts in the United States during the years 1995–2016. During this period, 608 of the nation’s approximately 12,000 districts had at least one charter school. Sixty-one percent of these districts have 10 percent or more charter enrollment, and 39 percent of these districts have 20 percent or more charter enrollment. (The number of districts in each group is smaller for the sample we use to study graduation rates.) The remaining, no-charter districts serve as a potential comparison group.
These data come from the National Longitudinal School Database, or NLSD, which we created at REACH, the National Center for Research on Education Access and Choice. The NLSD combines a wide variety of school and district data sources, including test-score data from the Stanford Education Data Archive, high-school graduation data from the federal Common Core of Data, and demographic data from the Common Core of Data and the U.S. Census.
While these data are not unusual, our approach to the analysis is in one key respect: We focus on system-level outcomes, which are an average of the outcomes of traditional public schools and charter schools located within districts’ geographic boundaries, weighted by school enrollment. This approach has two key advantages. First, it allows us to capture system-level results, which reflect the outcomes of all students (excluding private schools and home education). Second, one of the main concerns in studies of charter schools is that they might select or “cream-skim” the best students and inflate their outcomes. However, this type of selection is largely irrelevant in a district-level analysis of the total effects of charter schools. All students are counted in the analysis regardless of which type of school they attended. This is really an analysis of “systems” instead of “districts.”
We analyze these data using a method called difference-in-differences that compares a control group of districts with a treatment group. In this case, the control includes only districts that have no charter schools. The treatment group includes only “charter-heavy” districts, which we initially define as those that eventually reach at least 10 percent charter enrollment share. We then compare the trends over time in each group to see whether they diverge after charter schools open.
A key challenge in understanding any effect of charter schools is separating their impact on student outcomes from the impact of other policies aimed at improving schools that were adopted at roughly the same time. For example, states might adopt charter schools as part of a larger education agenda—which might include changes in school funding, investments in school facilities, or school accountability—that also affects student outcomes. Our matching method helps address this by focusing the comparison on districts that are otherwise similar and therefore are similarly likely to experience additional policies. If a state institutes new policies for low-performing schools, for example, the analysis will account for this by comparing districts that initially had similar performance levels.
It is also possible that non-policy factors could change at the same time that charter schools open. For example, demographics of a district might change, and, since outcomes are correlated with demographics, the results might change for reasons that have nothing to do with charter schools. To account for this, we sometimes control for demographics. We also test directly for demographic shifts that coincide with charter entry.
Yet another problem is that charter schools might intentionally seek to open in locations where the performance of traditional public schools is expected to decline. In that case, it might appear that charter schools are having a more negative impact than they actually are. The matching partially addresses this as well. In addition, we carry out “placebo” analyses in which we look for “effects” of opening high-school charter schools on elementary outcomes, which should not exist.
Average Effects on Test Scores and High-School Graduation
Though we examine a number of factors, we focus here on comparing districts with charter enrollment of 10 percent or more to no-charter districts, while controlling for other district characteristics including race/ethnicity, free-lunch eligibility, and urbanicity.
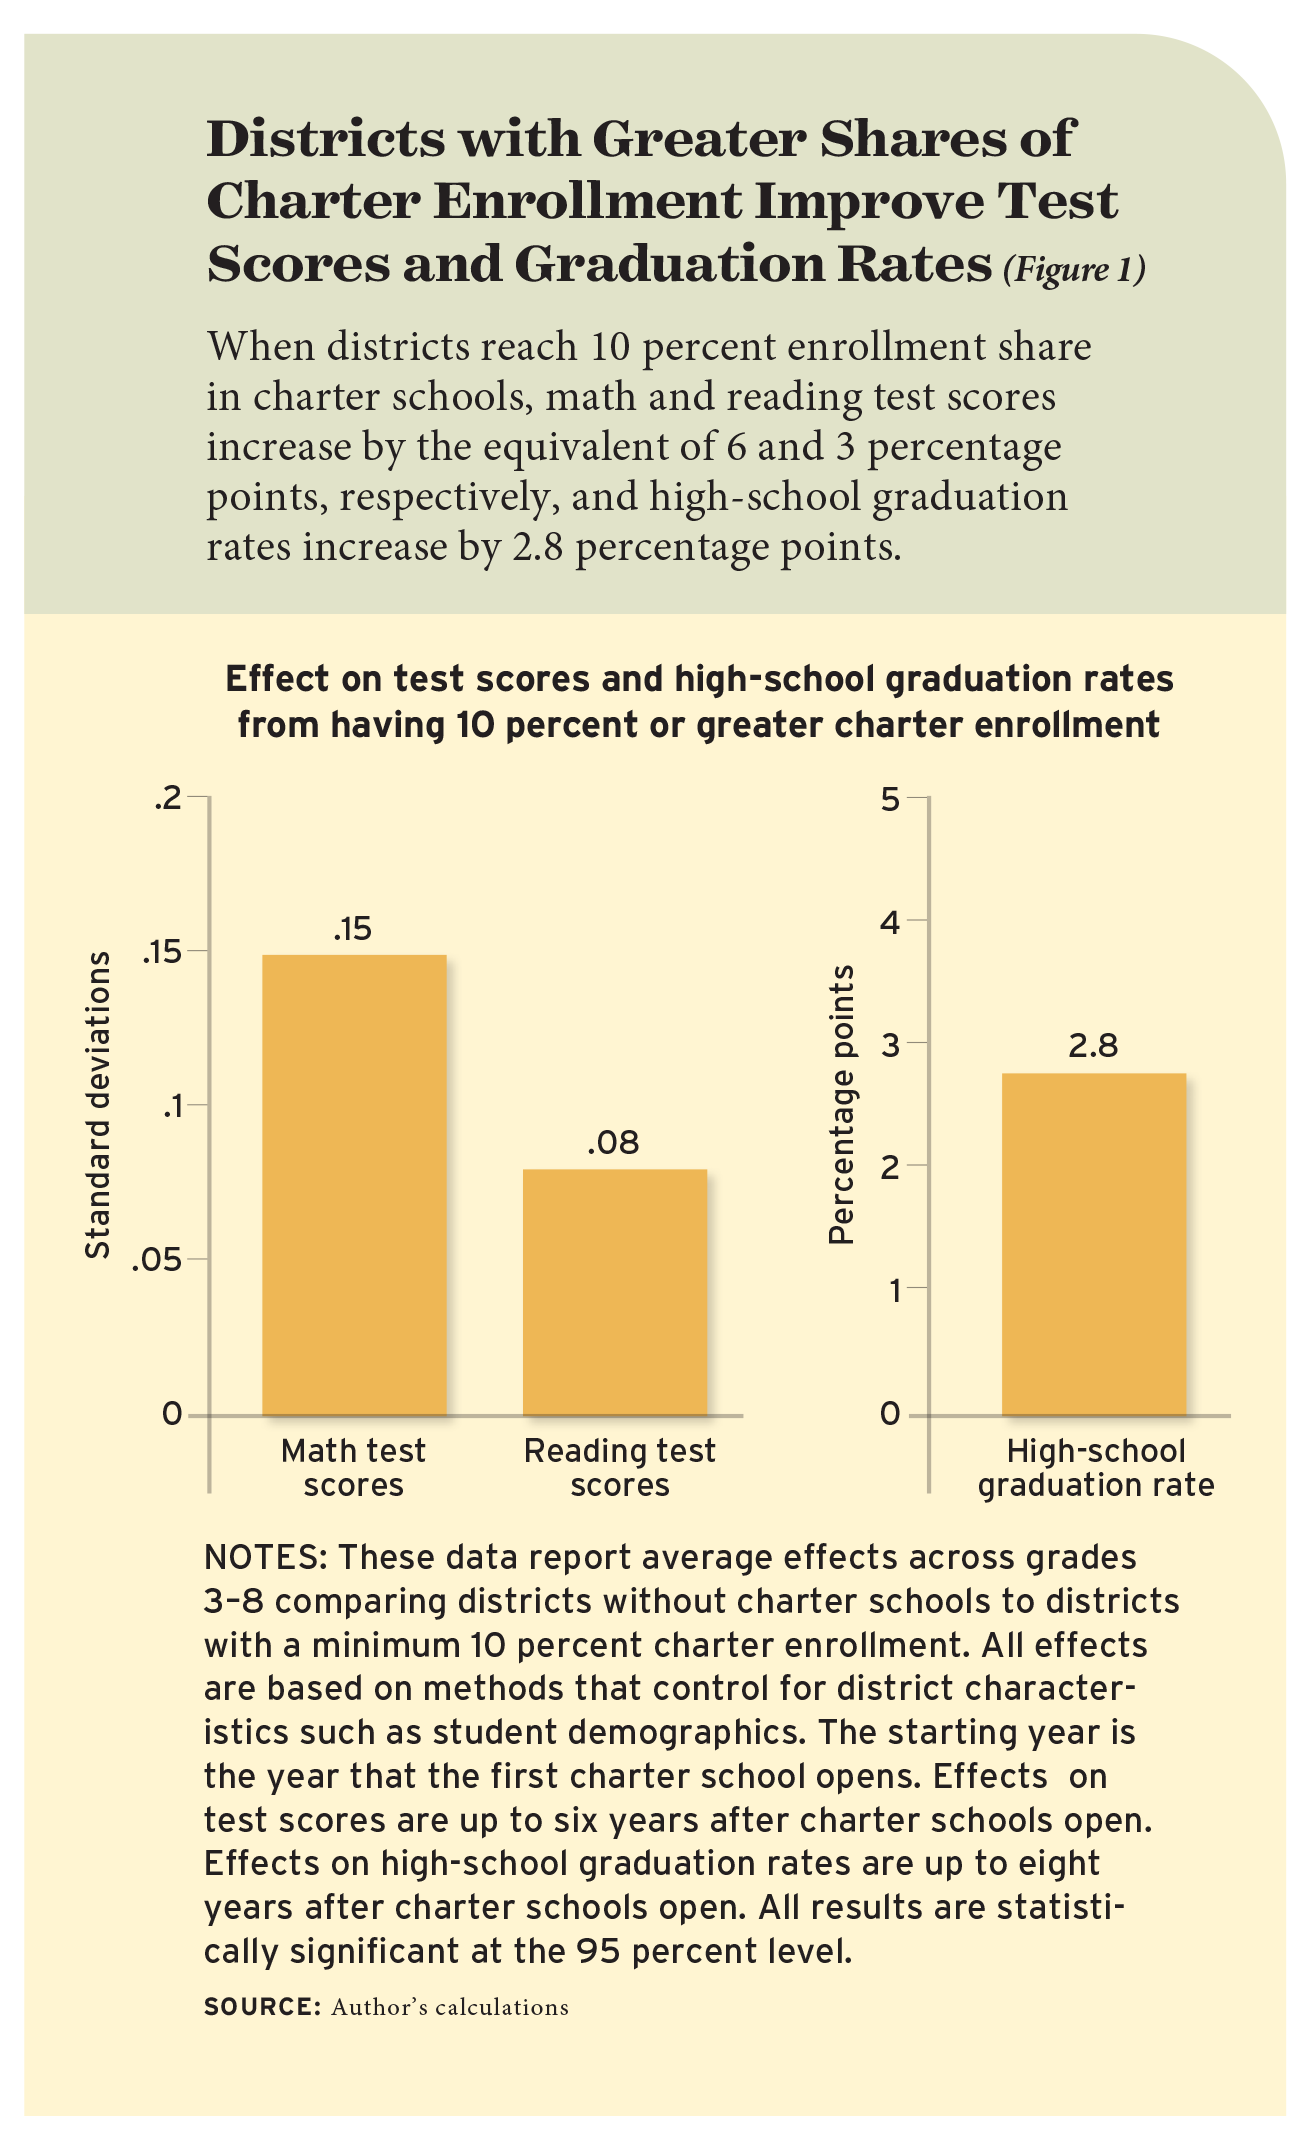
Figure 1 shows the effects on elementary- and middle-school test scores in math and reading up to six years after charter schools open. The first bar indicates that, when enough charters open to reach at least a 10 percent enrollment share, math test scores increase by 0.15 standard deviations, or approximately 6 percentage points. For reading scores, the increase is 0.08 standard deviations (the equivalent of 3 percentage points).
The right side of Figure 1 also shows a 2.8 percentage point increase in high-school graduation rates over an eight-year period when comparing districts without charter schools to districts with at least 10 percent charter enrollment.
Additional analysis reinforces our conclusion that these effects are the result of charter schools. To test the robustness of our estimates to different analytic choices, we alter the matching method, vary the control variables, fix the number of years after charters enter at five years, and address the staggered nature of charter-school openings. The results vary somewhat across our methods, but the general picture is the same. In fact, with graduation, the effects often appear considerably larger when we estimate them in other ways. The estimates in Figure 1 might therefore be conservative.
The analyses also generally pass the usual tests that give us confidence that estimates reflect causal effects. The comparison and treatment groups were on the same trajectories before charter schools opened. The placebo estimates reinforce our findings by confirming that the expansion of charter high schools is unrelated to outcomes of elementary-school students.
We also used an entirely different method. Rather than compare charter-heavy districts to no-charter districts, we compare each charter-heavy district to itself as charter enrollment changes. This “fixed effects” approach makes somewhat different assumptions than our main analysis, but this, too, yields very similar results.
Diminishing Returns
The 10 percent charter enrollment share threshold is arbitrary, and there are reasons to expect that the effects would be different if we picked other thresholds. For example, some have argued that having too many charter schools may reduce the performance of traditional public schools.
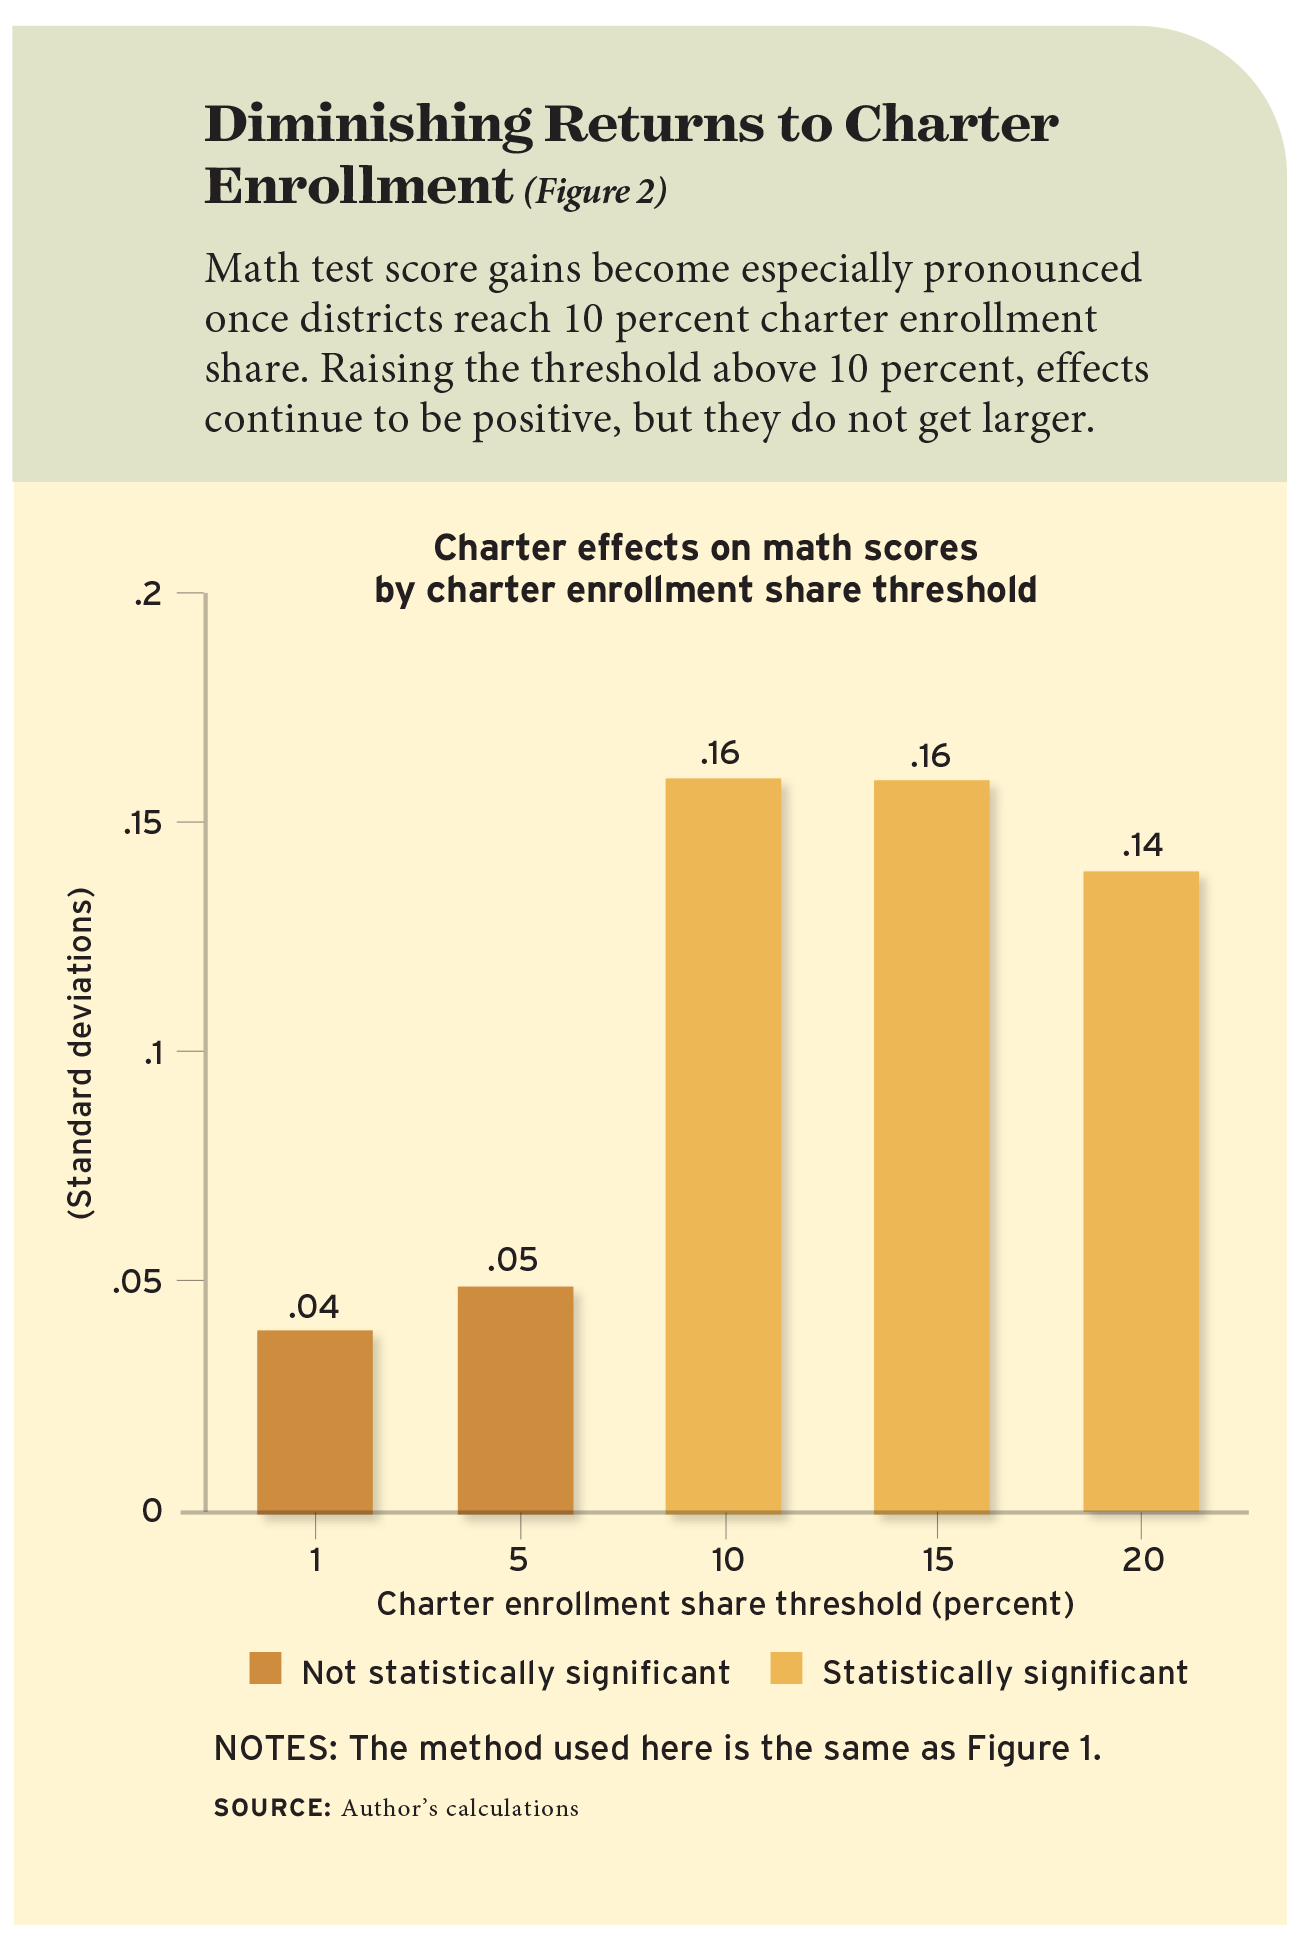
We find that increased charter enrollment share is generally associated with larger effects in the lower ranges of charter enrollment. Figure 2 shows that the improvement is especially pronounced once the threshold reaches 10 percent. When we raise the threshold above 15 percent, the effects continue to be positive, but they do not get larger.
New Orleans is an extreme case with the highest charter enrollment of any district. It has also been one of the more successful and well-documented examples of improved student outcomes. To test whether New Orleans might be driving the results, we dropped it from the analysis. The results are essentially unchanged when we do this. As in the prior analyses, this pattern holds when we use other comparison groups and other methods.
Do Charter Effects Vary by Student and District Characteristics?
The 10 percent charter enrollment threshold yields a positive effect on math scores for almost all of the subgroups we examine. In particular, our results show that the increase in math scores for districts with charter schools is larger in metropolitan areas. This is consistent with prior research, though, again, that research had focused on particular mechanisms, such as participant effects, not the broader systemwide effects.
More novel is our analysis by grade level and initial achievement level. Here, we consider high initial achievement as the top 50 percent of math scores nationwide and low initial achievement as the bottom 50 percent of math scores. We find some evidence of larger effects in middle schools and where initial (pre-charter) achievement was low. This is consistent with the theory that it is easier to improve when outcomes are low to start.
Our analysis includes not only average test scores, but also scores by student race/ethnicity and family income. We find evidence of improvements for every group as well. We see positive and statistically significant effects on math scores for low-income, higher-income, white, Black, and Hispanic students.

What Mechanisms Explain the Total Effects?
What exactly about charter schools leads to these effects? Prior studies have focused on whether charter schools are more effective than nearby traditional public schools or whether charter schools induce traditional public schools to improve through competition.
One key contribution of the present study is focusing attention on the net effects of all of these methods, including a third possible mechanism: how charter schools might replace low-performing traditional public schools. To analyze this, we use the same methods described above, but here we are interested in whether the opening of charter schools led any traditional public schools to close or be taken over. We find that higher charter enrollment share does increase the likelihood of closure or takeover of traditional public schools.
To further understand this, we used school-level measures of achievement growth from Stanford Education Data Archive. These measures are created by calculating the change in achievement between cohorts and years (for example, the change in scores between 3rd graders in 2010 and 4th graders in the same school in 2011). Prior research suggests that these growth measures are similar to “value-added” measures that more accurately capture what schools contribute to student learning.
We find that traditional public schools that close as charter schools open have lower-than-average achievement growth. We also find that charter schools tend to locate near relatively low-performing traditional public schools. This may partly explain why charter schools tend to be slightly higher performing than the schools their students would otherwise attend.
We also examined the effects of charter schools on private-school closures, but we find no evidence of such effects. This is important, too, given the possibility that students might switch from private to charter schools. We might also expect competition between schools when there are more charter schools; more schools mean more competition for students and funding. Indeed, we find that traditional public school performance rises with the charter enrollment share, though only slightly. This evidence may reflect correlation more than causation, but it is consistent with prior research that has examined charter entry more rigorously in specific locations.
Putting this research together with prior research, it does seem clear that multiple mechanisms play a role in explaining how charter schools improve student outcomes.
Implications
This study continues a general trend. Charter results continue to improve in studies using rigorous designs of charter effectiveness—including one recent study of voting—as well as more descriptive studies. The fact that we see find systemwide gains in high-school graduation rates on a national scale is significant, given how important graduation is for long-term life outcomes.
There is still much we do not know. While our work advances understanding of the system-level effects, we still know little about some indirect effects of charter schools. Some recent research finds that charter schools attract more high-performing teachers to the profession, some of whom end up in traditional public schools.
On the other hand, critics also point out that charter entry might be accompanied by increases in average student funding. This happened in New Orleans and may also have occurred in other locations where traditional public schools are funded mainly by local property-tax revenue and charter schools are funded separately by state funds. Relatively little research has examined this topic.
Another legitimate concern is about how charter schools operate and how they might affect other outcomes. In New Orleans, we found, for example, that the intense charter-school focus on test scores took schools’ attention away from the city’s centuries-long traditions in the arts. Whether this has happened on a national scale is less clear.
Charter schools may also have contributed to weakened ties between parents and schools, and among families within neighborhoods. School choice generally means that students have longer commutes to school, which can make it more difficult for parents to make it to parent-teacher conferences, attend sporting and other afterschool events, or pick up their children when they are sick. Choice may also weaken neighborhood ties as students living across the street walk to different bus stops and attend schools that are not in their neighborhoods and often on opposite sides of the city.
The bigger picture, as it turns out, is even bigger than it might appear. Still, this study is an important step forward.
Douglas N. Harris is director of REACH, the National Center for Research on Education Access and Choice. He is chair of the department of economics at Tulane University, where he also holds the Schlieder Foundation Chair in Public Education. Feng Chen is a PhD student in economics at Tulane University. A more technical version of this paper is available at reachcentered.org.
The post The Bigger Picture of Charter School Results appeared first on Education Next.
By: Douglas N. Harris
Title: The Bigger Picture of Charter School Results
Sourced From: www.educationnext.org/bigger-picture-charter-school-results-national-analysis-system-level-effects-test-scores-graduation-rates/
Published Date: Mon, 18 Apr 2022 09:00:59 +0000
News…. browse around here
Trading News: https://branch.centuryac.com/qcnfl/celebrities-who-disc-golf.html
Exciting Finds: https://www.cnnindonesia.com/teknologi/20211007164948-199-704816/bocah-as-temukan-fosil-diduga-gigi-naga-usia-12-ribu-tahun
Stay up to date on China: https://www.chinapulse.com/data-news/2021/05/24/crypto-miners-halt-china-deal-after-beijing-crackdown-bitcoin-dives-reuters/